Connected TV Device Global Market Share
July 21, 2021
“What’s the most popular OTT platform?” This is a question that we get asked a lot, but it doesn’t necessarily have a clear and concise answer.
Are you asking for the most popular device or operating system? Should we measure “most popular” by users, households, or something else? Do we measure devices purchased, accounts created, or viewing minutes?
There are so many variants to consider, it’s easy to skew the data in many different directions. We took three popular data sources, Statistica, Strategy Analytics, and Conviva and will explain what the data is measuring, what it means, and call out potential misconceptions.
Statistica, Smart TV streaming device market share worldwide as of 2020, by platform
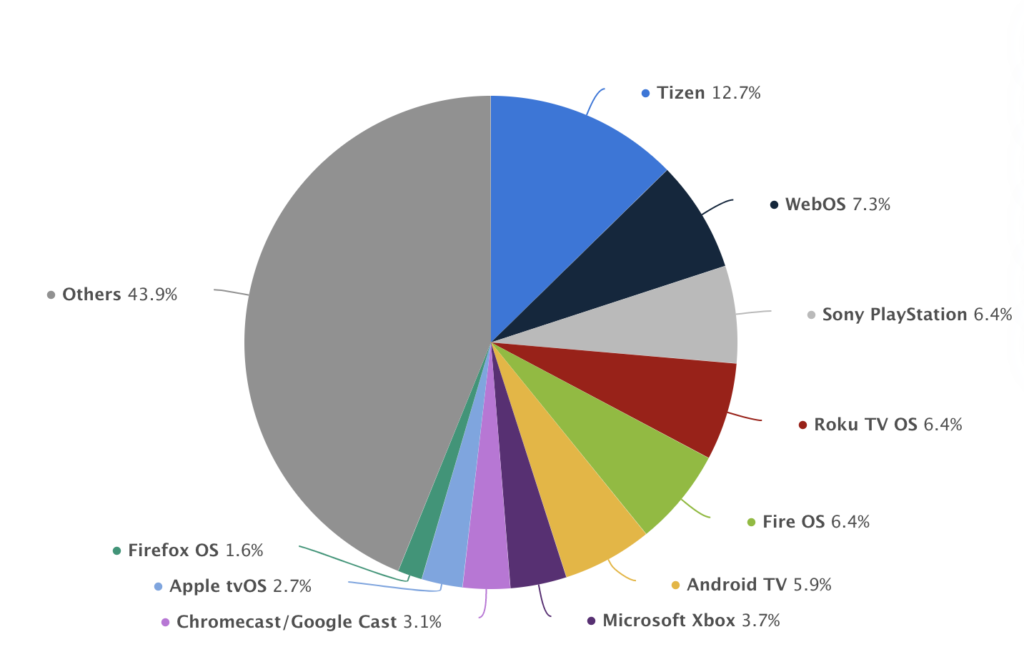
What this data is measuring: Device installation market share for all types of connected TV devices, including gaming consoles as of year-end 2020.
What this data says: This data says Samsung Tizen was installed the most, followed by the webOS (runs on LG Smart TVs), Roku TV OS, Fire OS, PlayStation, and Android TV(runs on Sony, Hisense, and other smart TVs).
Misconceptions:
- This data represents each country individually, as well as the global market.
- Response: Each country has very different market shares; this data does not accurately represent any individual country. As an example, what this data does not tell you, is that a very large majority of all Roku device installations are in North America.
- One installed device is equivalent to one user.
- Response: The amount of installed devices isn’t necessarily equivalent to the number of users. One user could have multiple devices installed. We also can’t assume that just because a device is being installed it will be used.
Strategy Analytics, Connected TV Devices, Global Quarterly Shipments
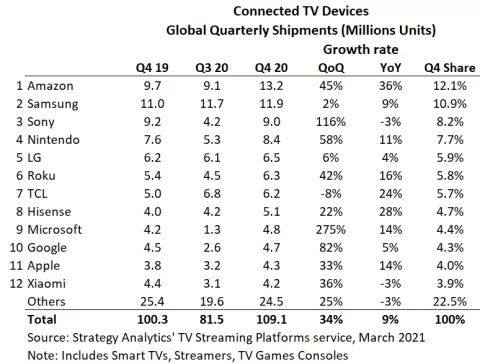
What this data is measuring: The global quarterly shipments of connected TV devices in 2020.
What this data says: This data says there have been the most shipments of Amazon Fire TV (12.1% share), followed by Samsung, Sony, Nintendo, LG, Roku, and TCL.
Misconceptions:
- This table is a representation of operating systems.
- Response: This table is not a representation of operating systems, only device types. A majority of TCL TVs have a Roku OS. Sony and Hisense TVs use the Android TV OS.
- Response: This table is not a representation of operating systems, only device types. A majority of TCL TVs have a Roku OS. Sony and Hisense TVs use the Android TV OS.
- The amount of device shipments represents the number of new users.
- Response: The amount of CTVs shipped doesn’t necessarily mean the device is gaining a new user. The shipment of a device could be a replacement for an older model, it could be a current user needing an additional device for a variety of reasons (personal or business), or it could be a new user. We also can’t assume that just because a device is being shipped it will be used.
Conviva, Global Share of Viewing Time Q1 2021
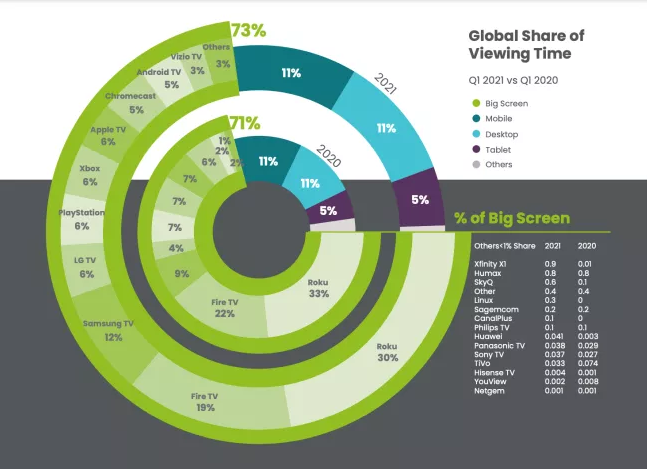
What this data is measuring: The global share of viewing time.
What this data says: This data says Roku leads the global viewing time at 30%, followed by Fire TV at 19%, Samsung at 12%, and LG TV at 6%.
Misconceptions:
- The share of viewing time is distributed evenly across the world.
- Response: This is not true, each country is different. As noted in Conviva’s report, “While Roku captured a significant 30% share of global big screen viewing time, this dominance was primarily driven by North America where it commanded 37% share in Q1 2021. In Europe, the second largest market for Roku, Roku only accounted for 8% share of the big screen”.
Conclusion
In conclusion, there are many different ways to capture and measure data and we’ve just barely scratched the surface with these three examples. After geographical location, you can narrow down your research even further by other factors such as age, gender, interests, etc.
To finally answer the proposed question “What’s the most popular OTT platform?” without any other knowledge, we can only say “It depends on your market and a lot of different factors”. At Float Left, we start by learning about your business needs and help you define your viewer profiles. From there, we can gather data from various sources to help you make informed decisions for your business. If you are interested in launching an OTT service but aren’t sure where to start, contact us to begin the conversation.